corrplot Correlation Analysis, t-Tests and a FastQC-to-DESeq2 RNA-Seq Pipeline in R
Published:
A 51-page reproducible R Markdown document covering three strands: visualisation, statistical testing, and a full RNA-seq pipeline.
Visualisation
A cell-tracking dataset: 11 shape and movement measurements for 6 animals (3 treated, 3 control), recorded with and without injury, over time.
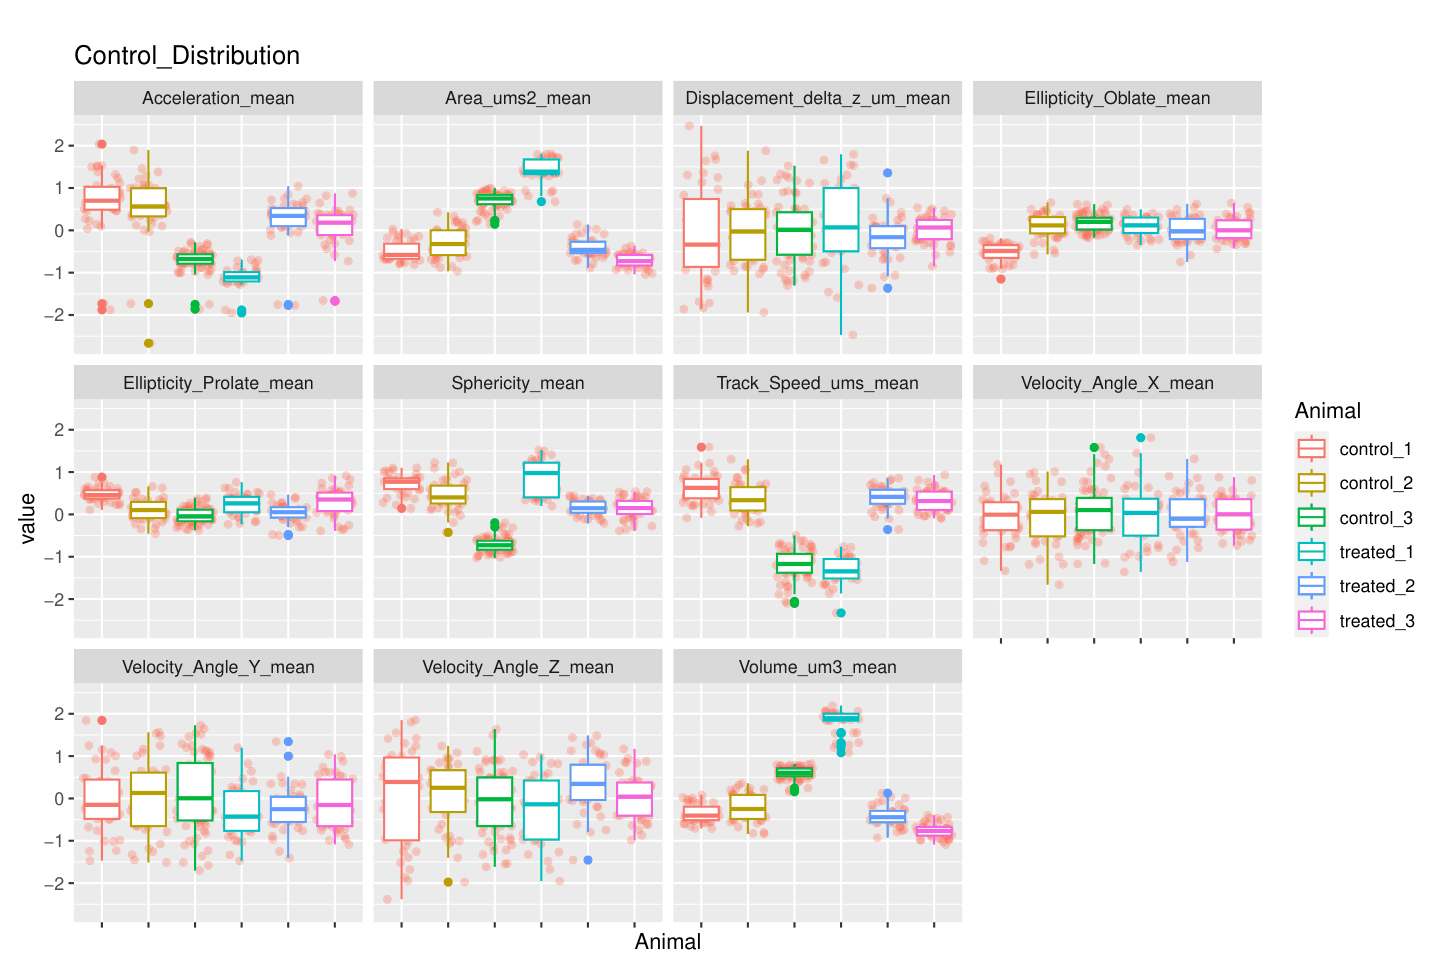
The 11 measurements for each animal in cells without injury, drawn with ggplot2. Plotting the design before testing it is what shows whether the groups are comparable in the first place.
Statistics
A Pearson correlation matrix over the 11 measurements, drawn with corrplot.
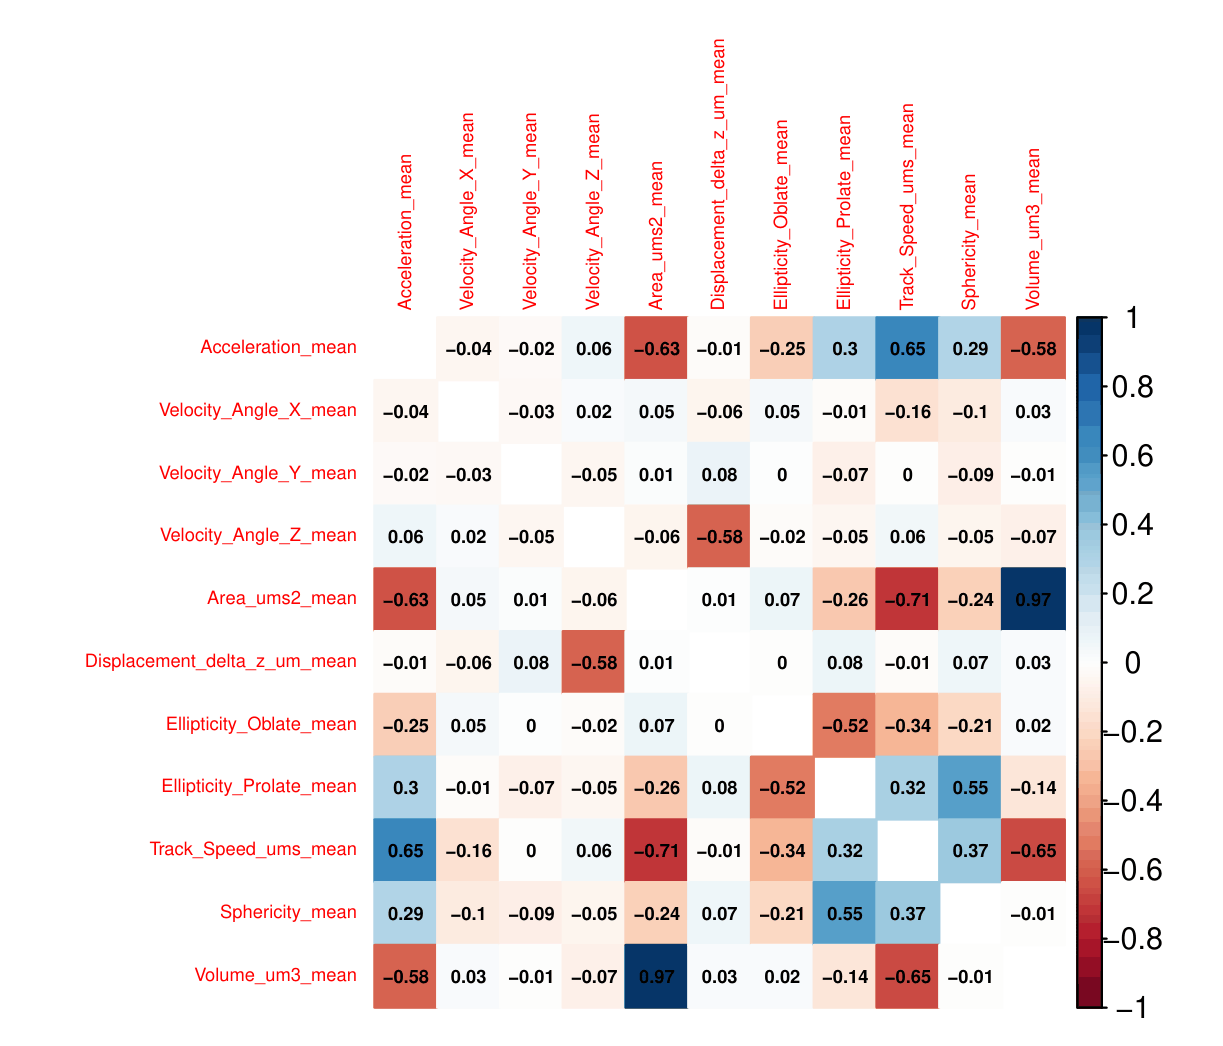
Correlations between the 11 measurements. Area and volume move together almost exactly (r = 0.97), and track speed falls as area rises (r = -0.71). Several measurements are therefore not independent, which matters for how many tests can honestly be run on them.
Two-sample t-tests on Velocity_Angle_X found no injury effect in either group (control p = 0.728, treated p = 0.596). Correlation with time was strongest for sphericity (r = -0.45). The written component covered when parametric tests are appropriate against their non-parametric alternatives.
Reporting a null result is the honest outcome here: the test was specified, run, and did not find an effect.
RNA-seq pipeline
The final section worked through a complete pipeline as a methods exercise:
- Quality control with FastQC and Rsubread on SRR3153255: 10,873,108 reads, 21 to 100 bp, 44% GC, no reads flagged as poor quality and no adapter content, so no trimming was needed.
- Differential expression with DESeq2 on SRP049988 (EHF overexpression against empty vector in lung carcinoma cells), with PCA, dispersion estimates and a heatmap of the top genes.
- Annotation through a BioMart gene ontology lookup.
This part is included as a demonstration of the pipeline rather than as a biological finding. The dataset does not support one: four of the top ten genes in the heatmap are Y-linked (KDM5D, EIF1AY, USP9Y, DDX3Y) and at least one EHF sample sits with the controls on PC1, which together suggest the dominant difference between samples is something the model had no term for, such as donor or cell line, rather than the EHF manipulation itself.